
Our research into the relative abundance of resources began when we looked at updating the famous wager between the cornucopian University of Maryland economist Julian Simon (1932–1998) and three neo-Malthusian scholars: the Stanford University biologist Paul Ehrlich; the University of California, Berkeley ecologist John Harte; and the University of California, Berkeley scientist and future director of President Barack Obama’s White House Office of Science and Technology John P. Holdren.[1]
The Ehrlich group bet $200 each on five metals: chrome, copper, nickel, tin, and tungsten. Then they signed a futures contract which stipulated that Simon would sell these same quantities of metal to Ehrlich’s group for the same price in ten years’ time. Since price is a reflection of scarcity, if population increases made these metals scarcer, Simon would pay, but if they became more abundant, and therefore cheaper, Ehrlich would pay. The bet would last from September 29, 1980 to September 29, 1990.
Between 1980 and 1990, the world’s population rose from 4.4 billion to 5.3 billion, or 20.5 percent. Yet the price of the five-metal basket barely moved, rising in nominal terms from $1,000 to $1,003.93, or 0.4 percent. Given that inflation amounted to 57.4 percent, all five metals became cheaper in real terms. In October 1990, Ehrlich mailed Simon a spreadsheet of metal prices and a check for $576.07, which represented a 36 percent decrease in inflation-adjusted prices. Ehrlich’s wife, Anne, signed it.
Ehrlich and his group lost because they thought like biologists. In 1971, for example, Ehrlich and Holdren wrote that as “a population of organisms grows in a finite environment, sooner or later it will encounter a resource limit. This phenomenon, described by ecologists as reaching the ‘carrying capacity’ of the environment, applies to bacteria on a culture dish, to fruit flies in a jar of agar, and to buffalo on a prairie. It must also apply to man on this finite planet.”
Simon won because he thought like an economist. He understood the powers of incentives and the price mechanism to overcome resource shortages. Instead of the quantity of resources, he looked at the prices of resources. He saw resource scarcity as a temporary challenge that can be solved through greater efficiency, increased supply, development of substitutes, and so on.
The relationship between prices and innovation, Simon insisted, is dynamic. Relative scarcity leads to higher prices, higher prices create incentives for innovations, and innovations lead to abundance. Scarcity gets converted to abundance through the price system. The price system functions as long as the economy is based on property rights, the rule of law, and freedom of exchange. In relatively free economies, therefore, resources do not get depleted in the way that Ehrlich feared they would. In fact, resources tend to become more abundant.
Simon’s victory would have been even more impressive had he used time prices (TP). The TP denotes the amount of time that a buyer needs to work in order to earn enough money to be able to buy something. That is the relevant price from the individual’s vantage point. Unlike money prices, which are measured in dollars and cents, TPs are measured in hours and minutes of labor.
The easiest way to calculate TP is to divide the nominal price by the nominal hourly income. If an item costs you $1 and you earn $10 per hour, then that item will cost you 6 minutes of work. If the price of the same item increases to $1.10 and your hourly income increases to $12, then that item will only cost you 5 minutes and 24 seconds of work. The most important thing to remember is that as long as hourly income is increasing faster than the money price, the TP will decrease.
As we already noted, over the course of the Simon-Ehrlich wager, the nominal price of the five-metal basket rose by 0.4 percent. Over the same period, the average global nominal GDP per hour worked increased by about 67 percent. To calculate the TP of the five-metal basket, we divided the nominal prices of the basket by the average global nominal GDP per hour worked. We found that the average TP of the five-metal basket fell by almost 40 percent. Had Simon and Ehrlich used TPs, Ehrlich would have owed Simon $627.57, or 8.93 percent more than he actually paid.
Remember that the bet between Simon and Ehrlich took into account the nominal prices of the five metals on September 29, 1980 and September 29, 1990. However, if we look at the average annual nominal prices of the five metals between 1980 and 1990, the average TP of the five-metal basket declines by 54.8 percent. So, for the same length of work, the average inhabitant of the globe saw his resource abundance increase from 1 basket of the five metals to 2.21 baskets. That amounts to a 121 percent increase in the average personal resource abundance (pRA). The average compound annual growth rate in personal resource abundance (CAGR-pRA) came to 8.27 percent, thus indicating a doubling of the average pRA every 8.7 years.
Did Simon get lucky by picking a propitious decade for his bet with Ehrlich, as some scholars argue he did? We decided to use our methodology to bring the bet up to the present. Between 1980 and 2018, the average TP of the five-metal basket decreased by 57.3 percent. Instead of just one basket, therefore, the same length of work bought 2.34 baskets. That amounts to a 134 percent increase in the average pRA. The average CAGR-pRA came to 2.27 percent, thus indicating a doubling of the average pRA every 31 years.
Finally, we have decided to extend our analysis of the Simon-Ehrlich wager all the way back to 1900. Between 1900 and 2018, the nominal price of the five-metal basket increased by an average of 3,660 percent. We were not able to calculate average global nominal GDP per hour worked for a representative sample of countries going back to 1900, but we do have excellent data on the U.S. blue-collar hourly compensation rate and the U.S. unskilled hourly wage rate going back to the eighteenth century. We used those two as our denominators to calculate TPs.
The average nominal U.S. blue-collar worker hourly compensation rate increased by 22,800 percent. That means that the average TP of the five-metal basket fell by 89.2 percent between 1900 and 2018. Thus, the U.S. blue-collar worker saw his resource abundance increase from one basket of the five metals to 9.26 baskets. The average pRA increased by 826 percent. The average CAGR-pRA rate amounted to 1.91 percent, thus indicating a doubling of the average pRA every 36.7 years.
The average nominal U.S. unskilled worker hourly wage rate increased by 14,100 percent. As such, we found that the average TP of the five-metal basket fell by 82.6 percent between 1900 and 2018. So, the U.S. unskilled worker saw his resource abundance increase from one basket of the five metals in 1900 to 5.75 baskets in 2018. The average pRA increased by 475 percent. The average CAGR-pRA amounted to 1.49 percent, indicating a doubling of the average pRA every 46.7 years.
Table 1: Personal Resource Abundance Analysis of the Simon-Ehrlich Wager
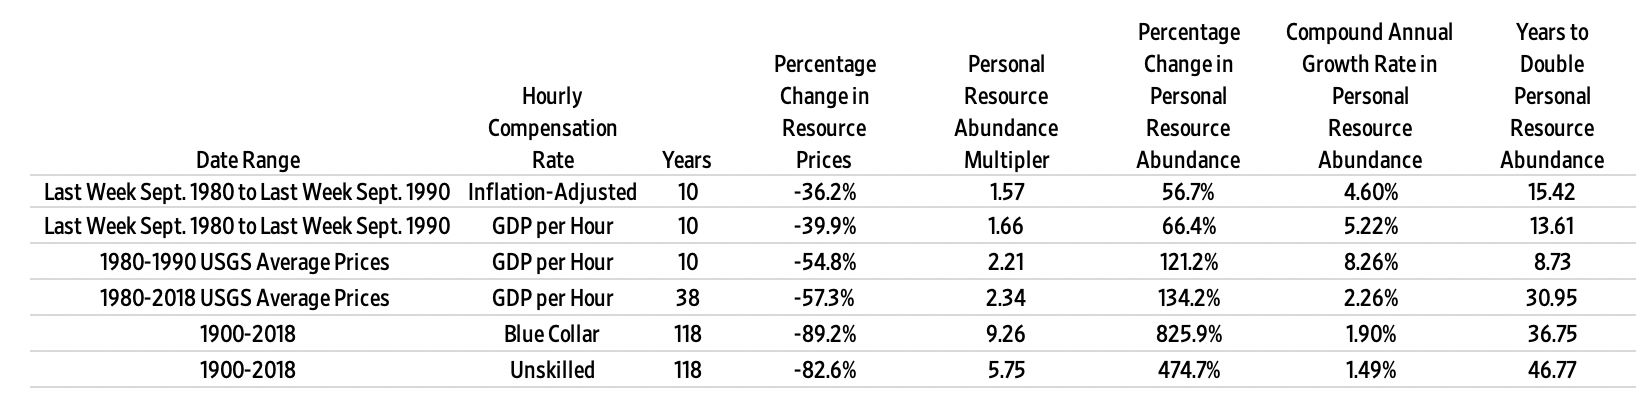
Source: Authors’ calculations.
Note that the above Personal Resource Abundance analysis looked at the abundance of the five metals from the perspective of an individual human being. The question that we tried to answer was, “How much more abundant have resources become for an average inhabitant of the planet or a typical U.S. worker between two points in time?” We believe that this is a key question in resource economics.
Next, we introduce the Population Resource Abundance analysis, which estimates the rise in total abundance in the world in general and in the United States in particular. It is this Population Resource Abundance analysis that allows us to quantify the relationship between abundance of resources and population growth—a question that’s central to the disagreement between Simon and Ehrlich.
You can think of the difference between the two levels of analysis by using a pizza analogy. Personal Resource Abundance measures the size of a slice of pizza per person. Population Resource Abundance measures the size of the entire pizza pie.
Table 2: Population Resource Abundance Analysis of the Simon-Ehrlich Wager
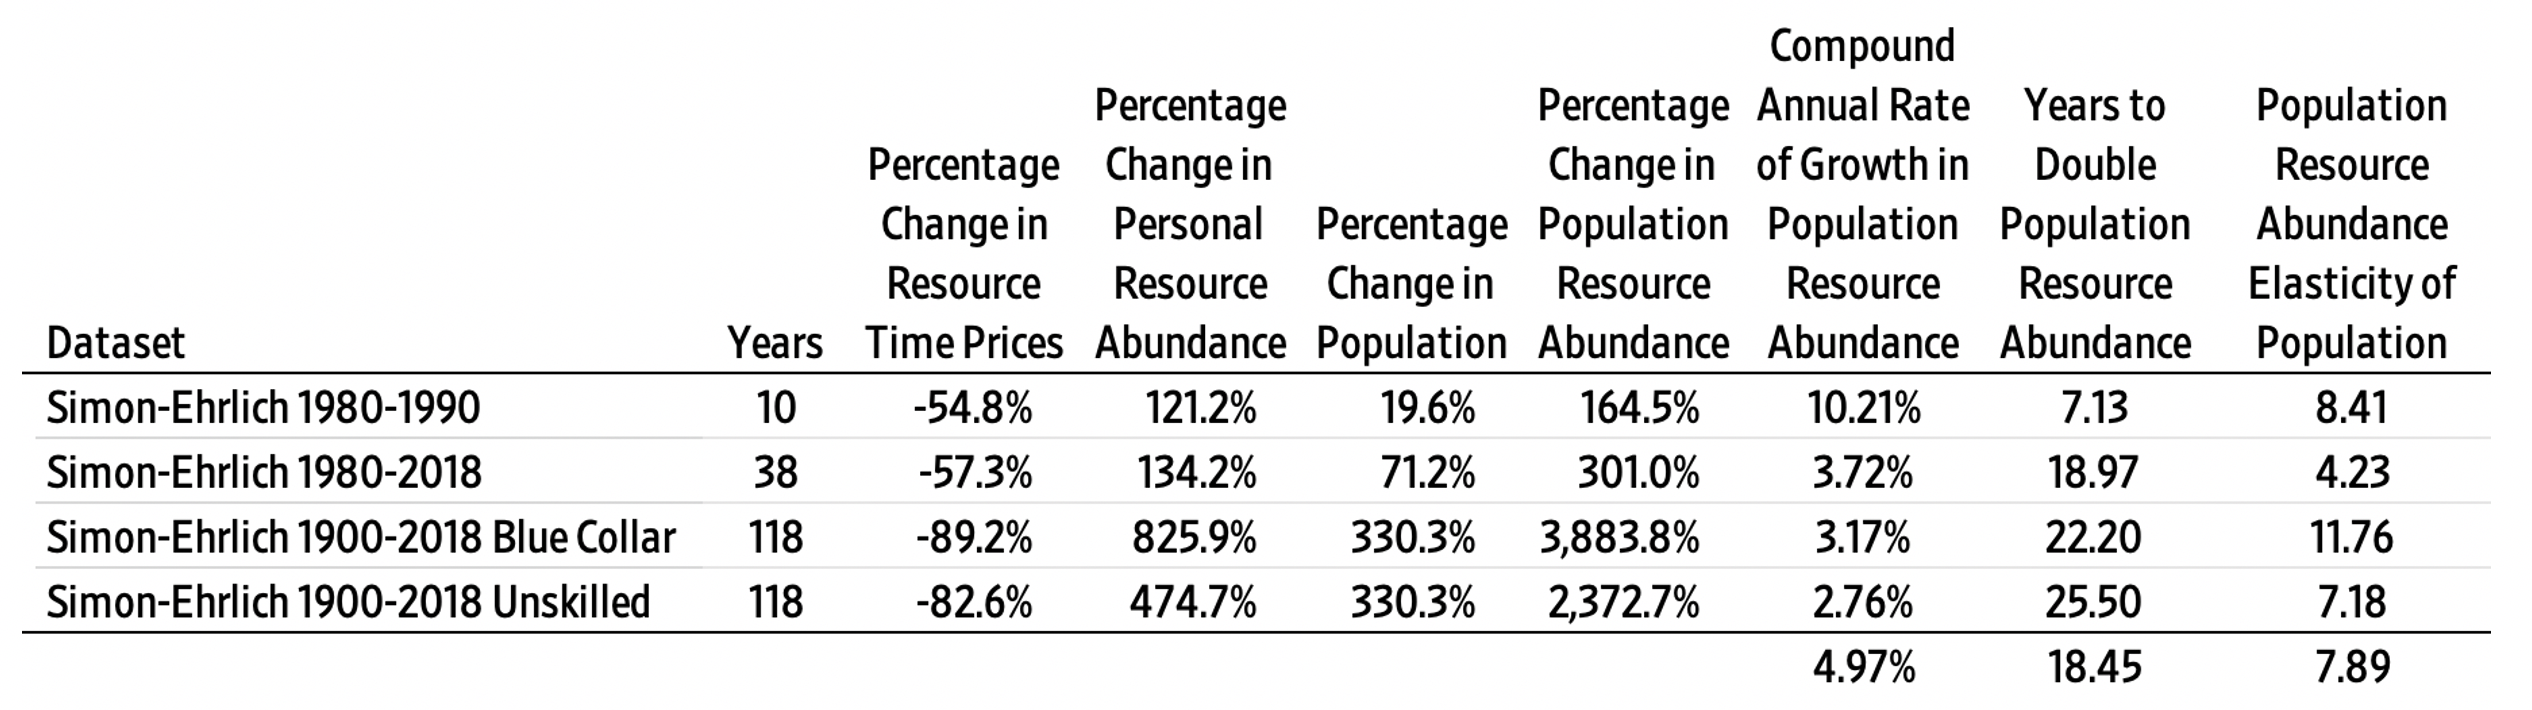
Source: Authors’ calculations.
As noted, the world’s population rose by 20.5 percent between 1980 and 1990. Yet population resource abundance (PRA) rose from one pie to 2.64, or 164 percent. The compound annual growth rate in population resource abundance (CAGR-PRA) amounted to 10.21 percent, indicating a doubling of PRA every 7.13 years. Furthermore, we found that every one percent increase in population corresponded to an 8.41 percent increase in the PRA of the five metals.
Between 1980 and 2018, the world’s population rose by 71.2 percent. Yet PRA rose from one pie to 4.01, or 301 percent. The CAGR-PRA amounted to 3.72 percent, indicating a doubling of PRA every 18.97 years. Furthermore, we found that every one percent increase in population corresponded to a 4.23 percent increase in the PRA of the five metals.
Between 1900 and 2018, the U.S. population increased by 330.3 percent. Based on blue-collar compensation, the U.S. resource abundance (PRA) rose from one to 39.84, or 3,884 percent. The CAGR-PRA amounted to 3.17 percent, indicating a doubling of PRA every 22.2 years. Furthermore, we found that every one percent increase in the U.S. population corresponded to a 11.76 percent increase in the PRA of the five metals.
Based on the unskilled wage rate, the U.S. resource abundance (PRA) rose from one to 24.73 or 2,373 percent. The CAGR-PRA amounted to 2.76 percent, indicating a doubling of PRA every 25.5 years. Furthermore, we found that every one percent increase in the U.S. population corresponded to a 7.18 percent increase in the PRA of the five metals.
Figure 1
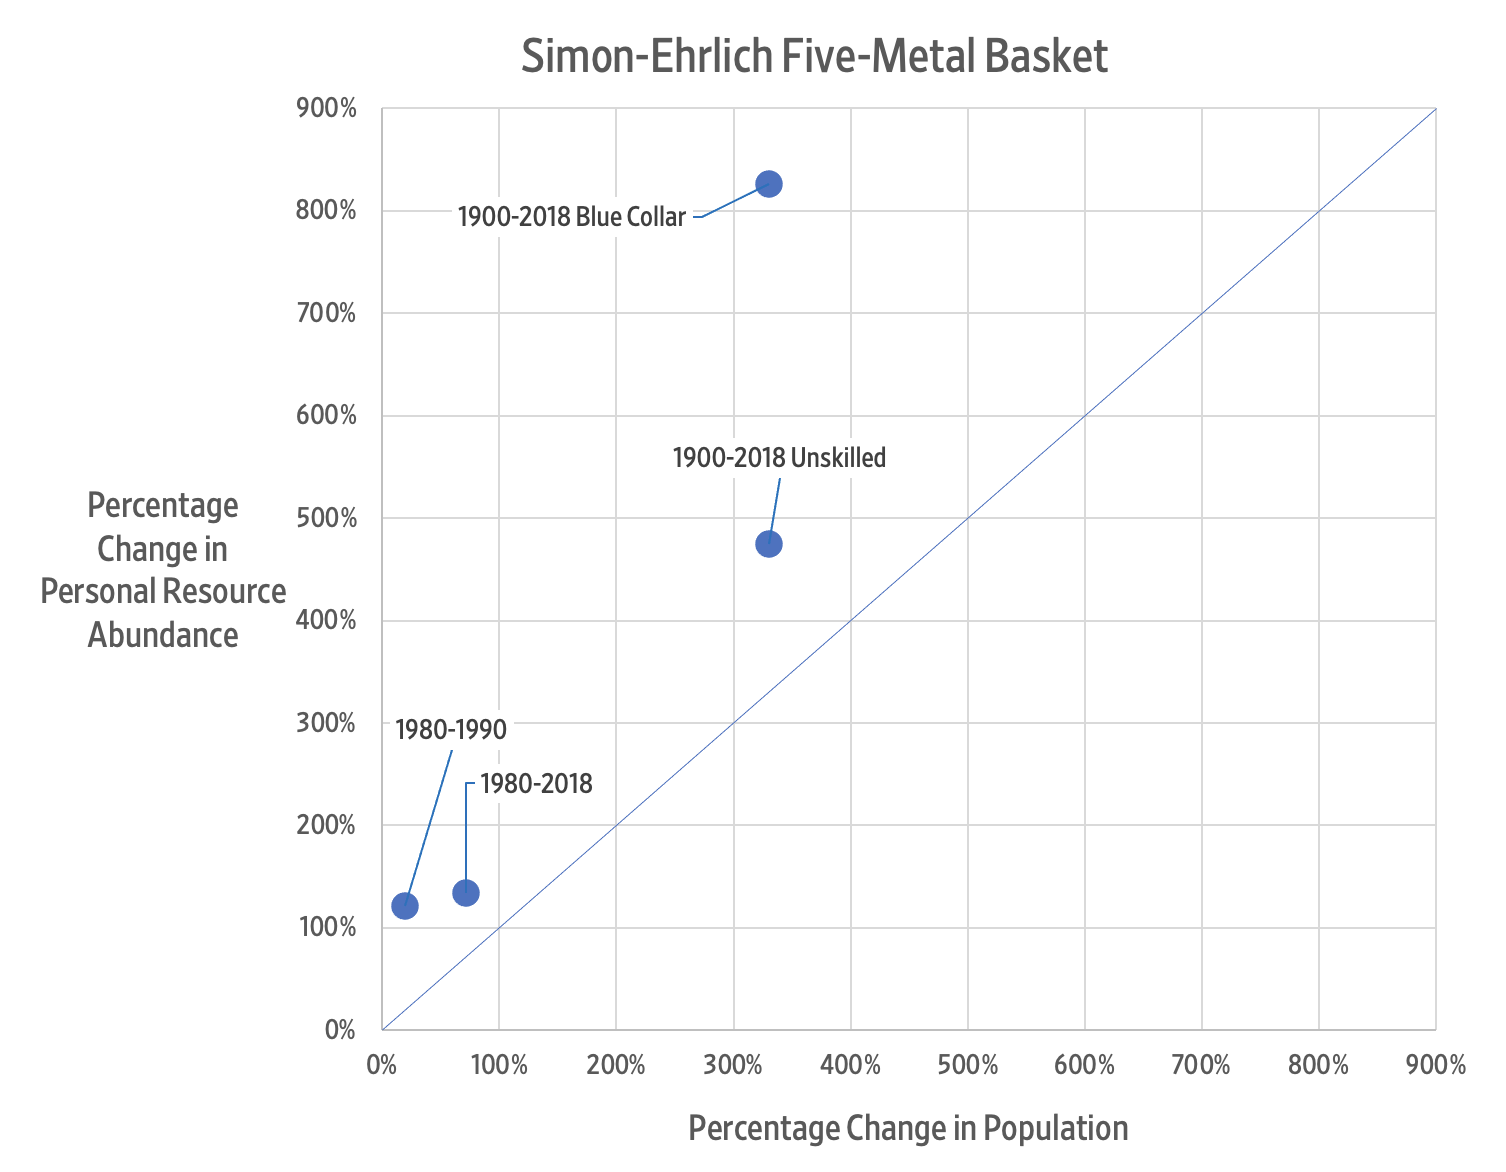
Finally, we found that humanity is experiencing what we term Superabundance—a condition where abundance is increasing at a faster rate than the population is growing. Data suggests that additional human beings tend to benefit, rather than impoverish, the rest of humanity. That vindicates Julian Simon’s observation that
There is no physical or economic reason why human resourcefulness and enterprise cannot forever continue to respond to impending shortages and existing problems with new expedients that, after an adjustment period, leave us better off than before the problem arose.… Adding more people will cause [short‐run] problems, but at the same time there will be more people to solve these problems and leave us with the bonus of lower costs and less scarcity in the long run.… The ultimate resource is people—skilled, spirited, and hopeful people who will exert their wills and imaginations for their own benefit, and so, inevitably, for the benefit of us all.
Note
[1] This essay is based on an upcoming book by Marian L. Tupy and Gale Pooley with the working titleThe Age of Superabundance: How Population Growth and Freedom to Innovate Lead to Human Flourishing on an Infinitely Bountiful Planet.